Lesson 1: A first workflow
Note
Have you already installed everything you need? If you’re not sure, check the “Before you begin” section of the introduction.
In this lesson. we’ll construct a very simple workflow that simply reads three numbers from its inputs and outputs their sum. It’s nealry trivial, but this will demonstrate the essentials of working with Tierkreis :
Defining a graph through its inputs and outputs
Constructing the computation
Using the inputs
Using simple nodes
Using built-in functionality
Checking what we’ve done with the visualizer
Running the workflow
Let’s get started!
Setting up the first graph
Workflows are defined by their graphs which described how the inputs produce the outputs. The first step in defining the graph is to specify those inputs and outputs. And part of that is knowing their names and their types.
Types are optional in Tierkreis, but since compile-time errors are cheap, and run-time errors are expensive, we strongly recommend using them everywhere.
Note
In order to keep a clear separation between the types used in the Tierkreis graph and the types already present in the Python
language we wrap the former with TKR. in other words, the TKR[A] wrapper type indicates that an edge in the graph contains a value
of type A. More on this in the core concepts
In general a graph can have any number of inputs or outputs. In this example, we have three inputs, so our first step is to create a python object to hold the inputs. We always use a NamedTuple for this. There’s nothing special about the name InParams, it’s just intended to be descriptive.
Since we have only one output, and we already know that the type isTKR[float], we don’t need to do anything for that.
from typing import NamedTuple
from tierkreis.models import TKR


class InParams(NamedTuple):
    a: TKR[float]
    b: TKR[float]
    c: TKR[float]
Graphs are built using a Graph. It needs to be instantiated with the types of its inputs and outputs.
from tierkreis.builder import Graph

g = Graph(InParams, TKR[float])
Building the Graph
Initially the graph doesn’t do anything. To change this we need to add some nodes to the graph. There are several kinds of nodes we can have - for example Inputs and Outputs are nodes - but the most useful kind are called Tasks. Roughly speaking a task is any kind of computation. Most tasks are done by Workers, but for basic things, like adding numbers together, we can rely on built-ins. Tierkreis has many built-ins API docs but the only one we will need today is floating point addition, aka add.
from tierkreis.builtins import add
Next we’re going to construct a graph by calling the builder functions.
Each function adds a node to the graph; the arguments are the input edges to the node, and the return values are its output edges. Notice that inputs is a special node created when we instantiated g and the names of the inputs are the ones we chose when defing the InParams class earlier.
x = g.task(add(g.inputs.a, g.inputs.b))
y = g.task(add(x, g.inputs.c))
Finally, we have to say which edges of our graph will be the outputs. In our example there’s only one.
Once you call finish_with_outputs the graph can be run as a Workflow.
With this call you also indicate that the graph wont be changed later
workflow = g.finish_with_outputs(y)
Congratulations - you build your first workflow! But what does it look like?
Using the visualizer
Tierkreis comes with an additional library to keep track of your workflows. The main use is to observe a running workflow, but you can also use it to examine graphs that you are currently constructing.
The visualizer will run a local web application in the same process. To stop its execution you need to user ctrl+c.
%%script false --no-raise-error
from tierkreis_visualization.visualize_graph import visualize_graph

visualize_graph(g)
Opening the web interface at localhost:8000 will show the landing page with the workflow overview.
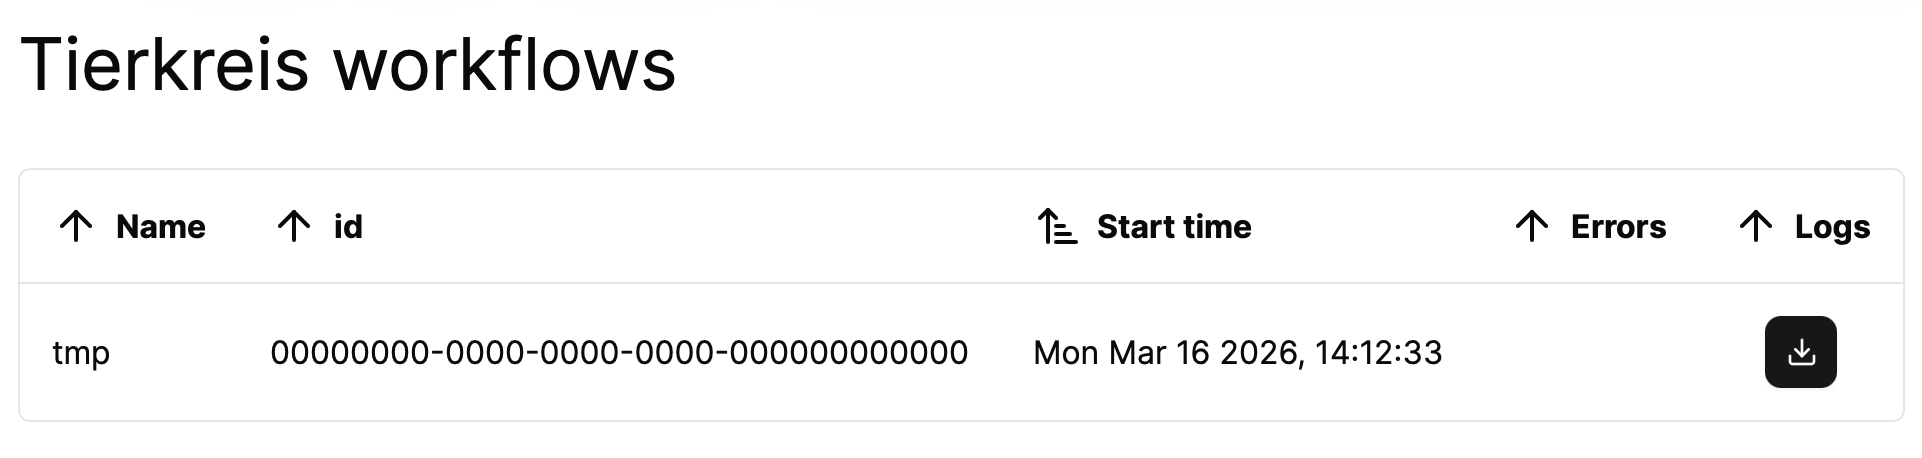
After selecting the tmp workflow you will see the graph representation you just created.
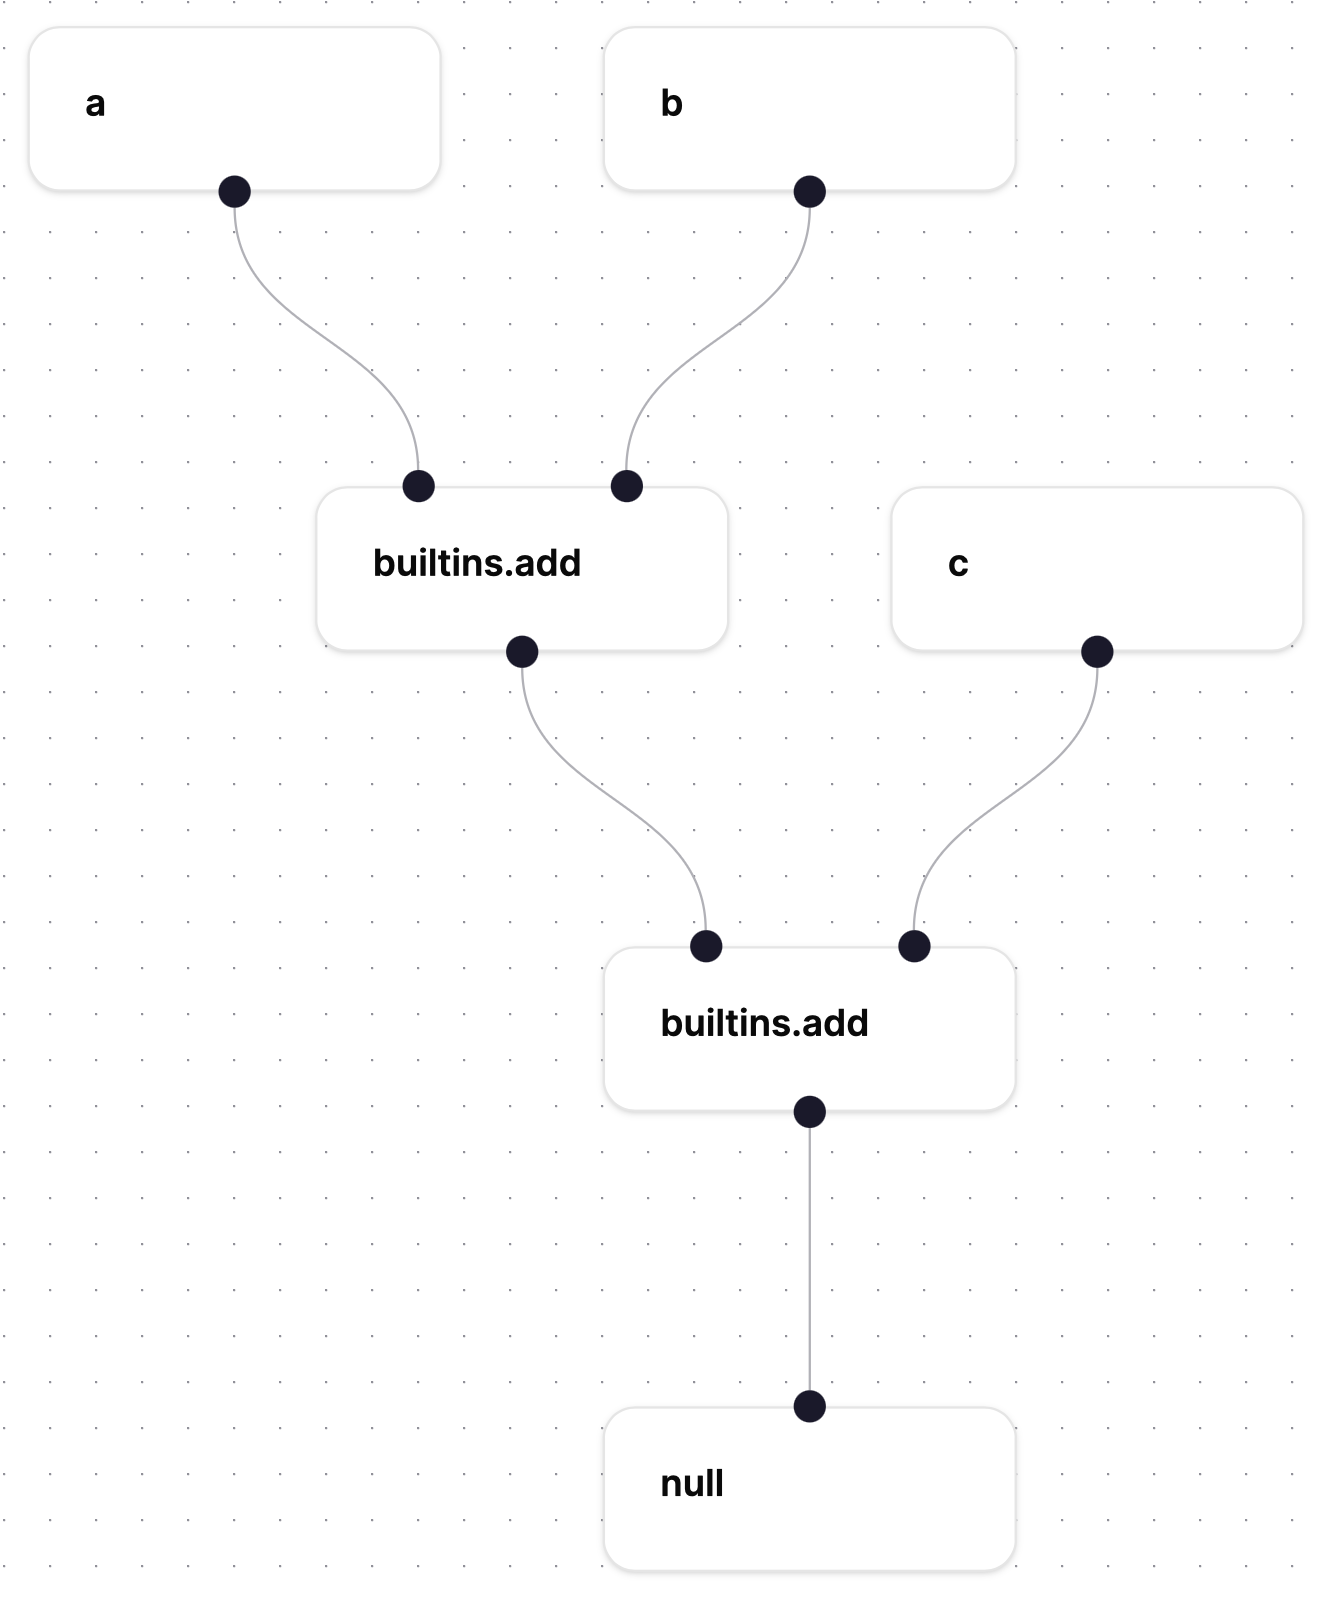
It shows the three input nodes a,b,c, the two task nodes builtins.add and an output with value null as the workflow hasn’t run.
For the same reason all the nodes are depicted in white, which means they haven’t been started yet.
To learn more about the visualizer see this page
Running the workflow
Now we have made the workflow, and checked that it looks like we expect, it’s time to run it.
Tierkreis can run in a lot of complex configurations, but for this tutorial we will be running it locally. It’s pretty simple, but there will be some code that we won’t explain here. To run a general Tierkreis workflow we need to set up:
a way to store and share input and output values (the ‘storage’ interface)
a way to run tasks (the ‘executor’ interface)
For this example we use the FileStorage that is provided by the Tierkreis library itself.
The inputs and outputs will be stored in a directory on disk.
(By default the files are stored in ~/.tierkreis/checkpoints/<WORKFLOW_ID>, where <WORKFLOW_ID> is a UUID identifying the workflow.)
from uuid import UUID


from tierkreis.storage import FileStorage

storage = FileStorage(workflow_id=UUID(int=12345), name="Hello World Graph")
If we have already run this example then there will already be files at this directory in the storage. If we want to reuse the directory then run
storage.clean_graph_files()
to get a fresh area to work in.
Since we are just using the Tierkreis built-in tasks the executor will not actually be called.
As a placeholder we create a simple ShellExecutor, also provided by the Tierkreis library, which can run bash scripts in a specified directory. In this case we can use None.
from tierkreis.executor import ShellExecutor

executor = ShellExecutor(registry_path=None, workflow_dir=storage.workflow_dir)
As the penultimate step we need to provide the workflow inputs to run as a dictionary which we get from the input class.. If the inputs are not provided the workflow will encounter an error.
inputs = InParams(0, 0.25, 0.5)._asdict()
With the storage and executor specified and inputs set, we can now run a graph using run_graph.
from tierkreis.controller import run_graph
from tierkreis.storage import read_outputs

run_graph(storage, executor, workflow, inputs)
result = read_outputs(workflow, storage)
print(result)
0.75