Visualization
To aid development, tierkreis provides an visualizer.
It can be installed with
pip install tierkreis-visualization
It extends the tkr cli with a vis subcommand which can be invoked as:
tkr vis
This will start a fastapi development server which by default shows all from the checkpoint directory ~/.tierkreis/checkpoints.
It will only include graphs that have been run with FileStorage at this location.
Running the visualizer
The visualizer is browser based and can be accessed at: http://localhost:8000
Programmatically the server can be run from python
from tierkreis_visualization.main import start

start()
Alternatively you can visualize a graph that is still under construction using the syntax
uv run tkr-vis-graph <PATH_TO_PYTHON_FILE>:<VARIABLE_CONTAINING_GRAPH>
For example one could run the following command from the root of the Tierkreis repo
if we have a graph outer_g in a file defaults.py (taken from ])
uv run tkr-vis-graph /defaults.py:outer_g
which will show one of the examples in the Tierkreis repo as a partially constructed graph. If you delete the optional ‘extra’ output on line 62 then the browser will live reload displaying the updated graph.
Programmatically this is available through:
from tierkreis.builder import Graph
from tierkreis_visualization.visualize_graph import visualize_graph

graph = Graph()
visualize_graph(graph)
which will block the execution. Reloading is not available through the programming interface.
Usage
The visualizer provides plenty information about the graphs in the system.
General Functionality
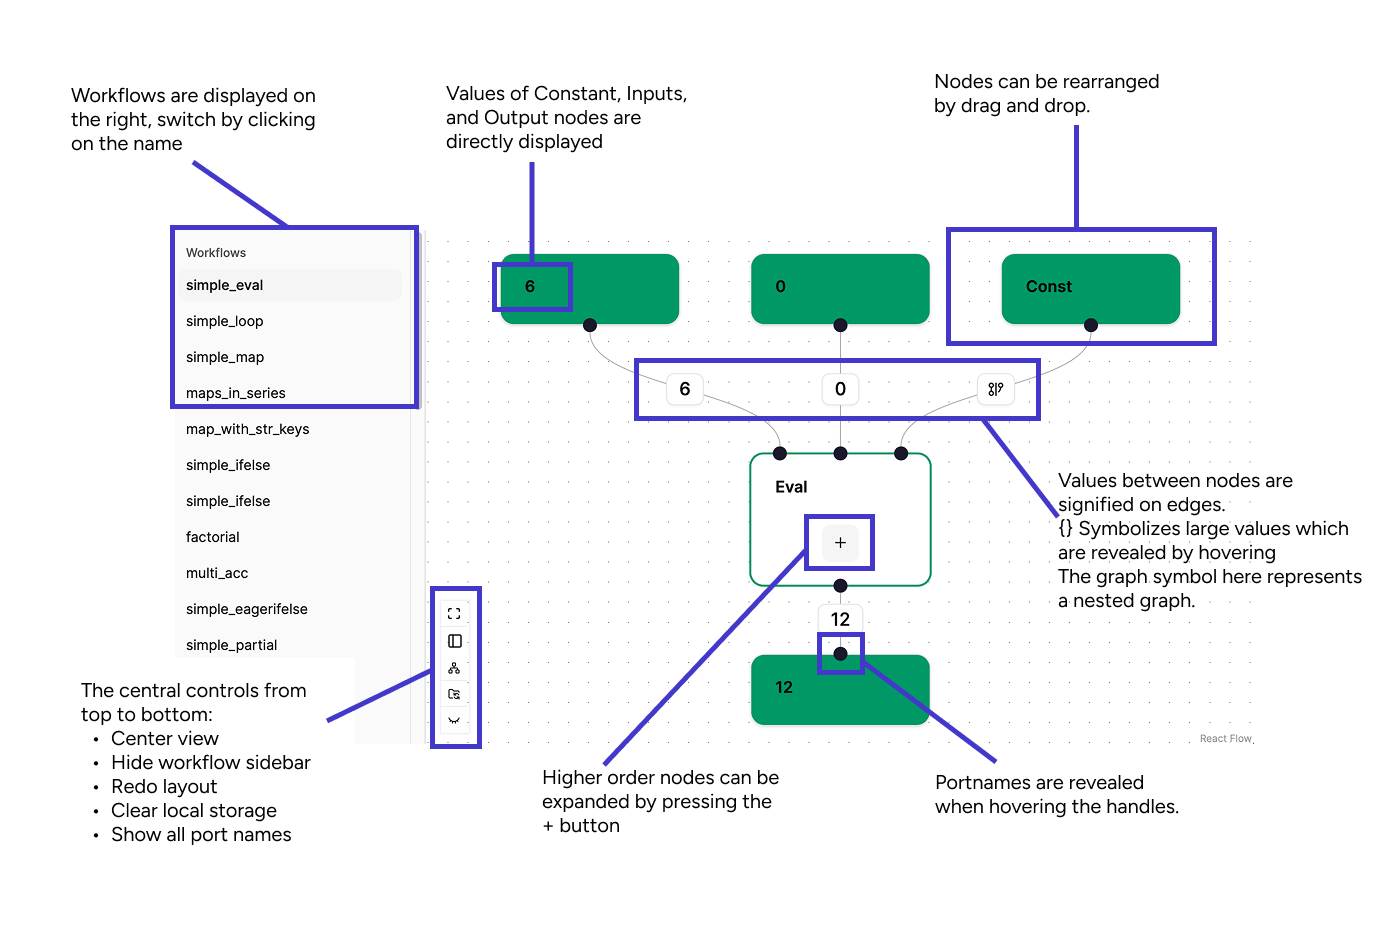
The nodes in the graph can be freely move by dragging them around the plane. At the bottom left of the main view there are three control buttons from top to bottom:
Centering the view
Hiding the navigation bar
Recalculation the graph layout
Reset Local storage, sometimes graph changes are not update correctly, clearing the storage and reloading resets the view
Showing/Hiding all node ports
Available Graphs
Available graphs are listed in the sidebar by their name.
Node Types
The visualizer will show the different node types:
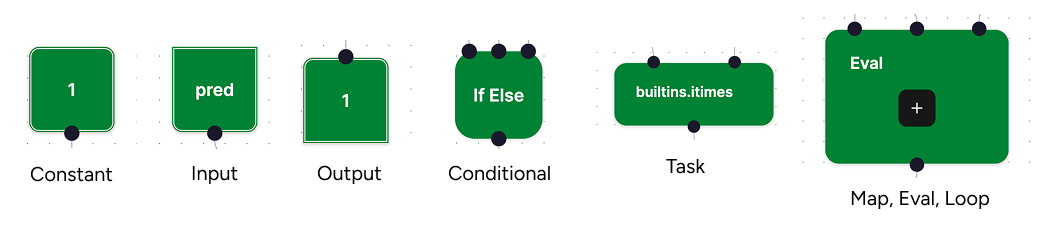
Constant nodes: squares with rounded corners and a double border.
Input nodes: squares with rounded corners at the bottom, regular corners at the top and a double border.
Output nodes: squares with rounded corners at the top, regular corners at the bottom and a double border.
Conditional nodes: squares with strongly rounded corners and a regular border.
Task nodes: Rectangles with rounded corners and a regular border.
Map, Eval, Loop nodes: rectangles with rounded corners, a regular border and the expansion button.
Node Status
The node status is indicated by the border color of the nodes:

From left to right
Yellow: Node is currently running
White: Node has not been started yet
Green: Node is finished
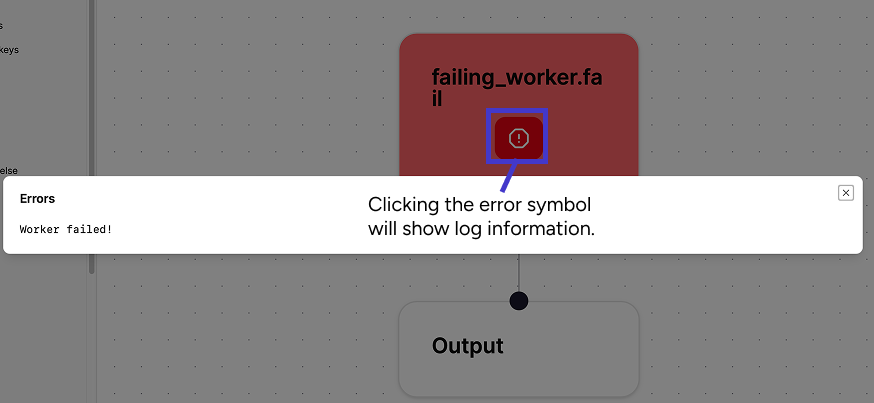
Red: An error has occurred in the node (or one of its nested nodes)
Ports & Values
Inputs and outputs of nodes are indicated by black circles (handles) on the nodes border.
Inputs are at the top, outputs at the bottom.
Hovering a port will show the port name.
By using the control button, all ports can be shown simultaneously.
The values in a graph are only visible once the graph has run, indicated on the edges connecting a port.
Small values will be displayed, larger values are truncated with a {} symbol.
Hovering the symbol shows the entire value in json format.
The graph symbol indicates a value is a constant subgraph supplied as a nested graph.
Values can be downloaded as outputs from the detail view.
Nested Graphs
The higher order nodes eval, map, and loop can be expanded by pressing the + button.
This will show their nested structure.
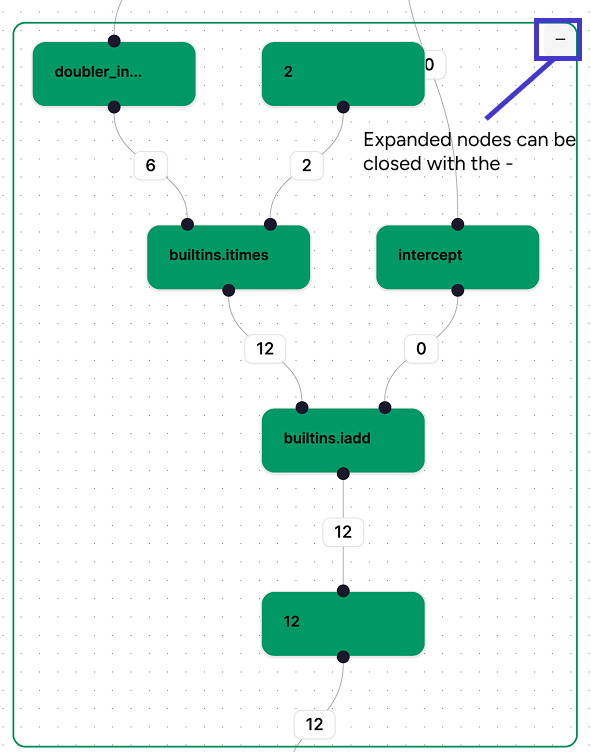 For
For eval nodes this will immediately be the nested graph;
For map/loop nodes this will show the individual elements/iterations which each contain their own subgraph.
For unevaluated graphs, this will only show a placeholder evaluation.
To hide the graph again use the - button at the top right.
The other two buttons allow for resizing the bounding box and moving the node with all its children.
Detail View
Detailed node information can be accessed by by double-clicking a node. By default this will show:
Node Type
Execution information: Start, End, Duration
Task nodes only: Inputs with downloadable values
Outputs with downloadable values
Logs (for task nodes) or data entries
A restart button for the node and its dependents
If an error has occurred on a node, errors logs will be shown instead of node logs.